400 Errors When Migrating from NGINX to Envoy
A look into the work our core infrastructure team does


Mario de Frutos
In this blog post, we’ll describe the process we followed to investigate and fix an issue we suffered when we migrated from NGINX to Envoy: a sudden and dramatic increase in 400 errors. This is the kind of work that the Core Infrastructure Team does.
We are a small team—just four people (but hiring!)—that handles the observability, reliability, performance, and scalability of the infrastructure and core services. Here’s how we addressed this particular issue.
On March 31, we detected an increase in HTTP 400 errors in one of our endpoints; the increase was about two orders of magnitude, as we can see in the following chart:
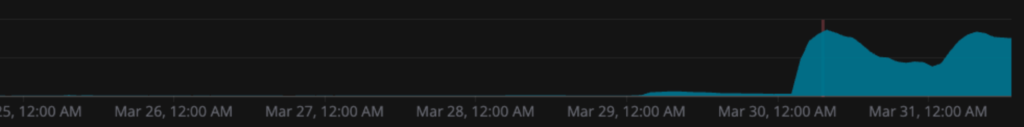
It’s worth noting that this issue affects all our POST endpoints, but it was very visible with this specific endpoint. While a huge increase relatively, it was still an extremely tiny proportion of the total number of requests, so it was very hard to detect. We were lucky that we were able to see the issue, but once we did, it was obvious that something had happened once we looked closer at this endpoint.
Funnily enough, the same problem was also independently detected when analyzing a small regression in our latency metrics because the requests were getting stuck and taking 30 seconds (the timeout) to complete.
At first, we started investigating if the issue was related to one of our code deployments, but it turned out that the spike correlated perfectly with Envoy’s deployment to production.
We recently changed our NGINX instances for Envoy to gain more visibility without having to do “black magic” with Lua scripts. The rollout was really smooth, but it looked like the behavior was different in some requests, and in Envoy’s case, we were returning 400 errors for an unknown reason.
Of course, we considered a rollback, but the requests were indeed correctly being served a 400 because they were missing data, and the number of correct requests looked unchanged. These seemed like “new” bad requests, so we decided to dig deeper into the issue to fully understand the cause.
Initial Steps
First, we analyzed the kind of request that was failing, which turned out to be a POST request where we’re sending a big payload to be stored. The request log in our backend service showed that the payload was null, which means that we’re forwarding the request that arrives at Envoy to our backend service but, for some reason, not sending the POST payload. Knowing that, we first needed to know if we were also not receiving the payload in Envoy or if, for some reason, we were not sending it from Envoy to our backend.
The first thing we did was to include a Lua script in our Envoy to gather the request body and check whether or not those faulty requests were receiving the payload. We found that the POST payload was also not present when dumped from Lua. This didn’t help much, since it could have meant that the client was not sending it or that Envoy couldn’t parse it for the same reason it was not forwarding it, and that could be the reason it was not available in Lua. We needed to know what was truly arriving at Envoy.
Also Read: Hybrid SDK Architecture at RevenueCat
Capturing Traffic
The next step was to start capturing traffic on both sides—from the load balancer to Envoy and from Envoy to our backend—to discover if we were processing the payload correctly, or something was happening in the middle. While this sounds simple, our infrastructure handles close to 1 million requests per minute, and we have around 100 servers at peak. Being able to capture these rarely occurring requests was not an easy task.
To be able to capture a percentage of the traffic for that particular endpoint, we started defining a new listener rule in our load balancer to redirect traffic from that endpoint to our capturing environment. That way, we were now able to define the percentage of the traffic as show below.

With this set up, we now had a way to redirect traffic to be captured, but we also needed to know how to capture traffic in ECS. To capture Docker traffic inside an ECS instance, we used this specific Docker image that has all the needed network-related tools already installed. We love the paradigm of immutable infra, and we don’t like installing one-off tools in specific instances because that can lead to side issues that are themselves hard to debug.
You can use an external Docker image attached to the same network namespace of the container to be inspected (or process namespace, if you are debugging code). This allows you to have a lot of debugging tools while keeping production images always clean and lean.
We ran the container using the tcpdump command, which will capture traffic over the course of a whole day but store files every 10 minutes both for traffic coming from the load balancer (at port 8080) and traffic going between Envoy and our backend (port 8000).
docker run -ti --net container:72ae33239d01 nicolaka/netshoot tcpdump -G 600 -W 144 -s 0 -i eth0 -w elb_envoy-%Y-%m-%d_%H.%M.%S.pcap port {{PORT}} |
Containers and Debugging
We want to provide more detail about how we did the debugging at the container level.
One important issue related to our debugging task was knowing how the Docker containers connect to the network stack. You have various options for connecting your Docker container: bridge, host, container network, or overlay.
Also Read: The “Reply Already Submitted” Crash
By default, you usually connect to the network using the bridge option, but in this specific case, we wanted to sniff traffic using another container network so we could access its traffic. And how does that work? Well, Docker containers are created using Linux kernel namespaces to provide isolation with the underlying host. Docker creates a set of namespaces for the different aspects of the container—PID, NET, IPC, MNT, and UTS—as you can see here. (There is also the cgroup namespace that allows you to do some resource control, but that is not our interest right now.)
In our case, we focused on the NET namespace because we wanted to sniff traffic on the other container’s network stack with our debugging container. To be able to do that, we used the `–net container:ID` option provided by the Docker engine so we could join and share that container network stack.
Once we had our debugging container connected to that network stack, we were able to sniff the traffic using tcpdump or other tools.
You may be wondering: Why not install those tools in the container and use them? The main reason is that our container should have a single responsibility: to contain those services that are designed for it. However, we also reduced the security risk surface area by not adding possible vulnerabilities to our production container for debugging purposes.
Analyzing the Traffic
At this point, we had enough information to keep investigating what was happening. Loading the pcap files in Wireshark allowed us to visualize the traffic and follow every single request to know more about the behavior of our system.
We take privacy very seriously, so we only resort to capturing and reviewing network traffic in extreme cases: when we are seeing issues that can’t be solved with our regular logging (which scrubs private information). Also, this endpoint, fortunately, does not receive sensitive data.
Checking the TCP streams, you can see how a normal POST request looks:

Basically, you see an initial TCP segment with the flags [PSH, ACK], which includes all the HTTP headers, and then we have another segment with the payload—both are sent from the load balancer to our Envoy. The PSH flag is set because the client is forcing a flush on the connection to send the headers immediately without waiting for a full buffer to be filled.
Once those segments are received, Envoy returns an [ACK] segment to the load balancer, and finally, after processing the segment, Envoy sends the HTTP response to the load balancer, and we finish receiving a [ACK] from the load balancer.
When we searched for one of those faulty requests, we saw the following behavior:

Analyzing those traces, we saw that only the first segment was sent. The POST payload was not being sent to the backend because Envoy received a FIN from the load balancer to close the connection.
The client, for some reason, was closing the connection before the full request (with the payload) was sent. For our backend, this meant that we were waiting for the rest of the payload until the timeout was reached, and we returned a 400 response because of a malformed request.
Knowing that, we analyzed the load balancer access logs to confirm if the client closed the connection or, for some reason, our load balancer was closing connections.
To gather that information, we needed to activate access logs in the load balancer options:
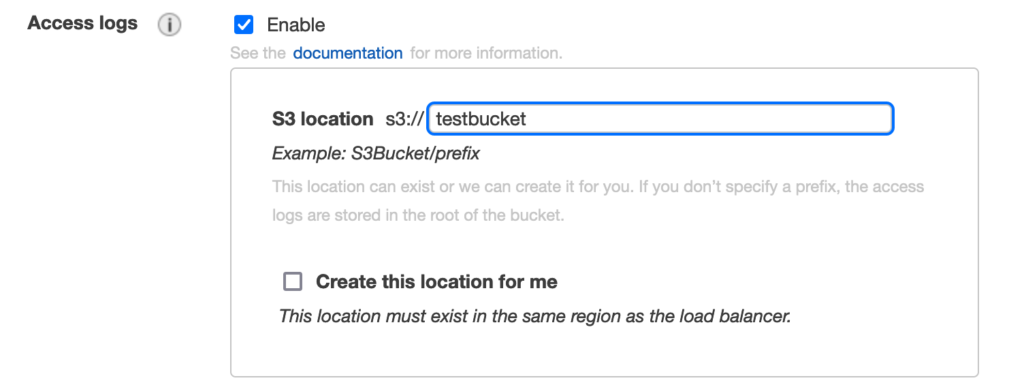
Once we had enough logs, which were put in the S3 bucket every five minutes, we searched for the request filtering by the X-Amzn-Trace-Id header. Analyzing those traces—you can see more information about the fields here—we could see that the load balancer was returning 460 status. This means that the load balancer received a request from a client, but the client closed the connection with the load balancer before the idle timeout period elapsed.
In summary, at this point, we knew that the client was closing the connection in the middle of a request without sending the payload, which generated 400 errors from our side. But why would this happen with Envoy but not with NGINX?
NGINX vs. Envoy Behavior on Partial Requests
The difference between NGINX and Envoy behavior is that the former waits for the full request before proxying it to the backend, while the latter streams the requests. We confirmed this by checking the documentation: As you can see here, NGINX does buffer the requests by default, but Envoy needs a special filter for it (as you can read in this issue).
Streaming proxies usually pose some advantages in terms of latencies but do not protect the backend as well as when the whole request is buffered before being sent to the backend. Given how brittle and limited our flask backend is, buffering seems the best choice.
To solve this issue, we needed to activate the buffering capability, so we were able to wait for the full request before sending it to the backend. Luckily for us, Envoy has a buffer filter option that we could activate in our configuration—the only caveat was that the buffer size needed to be fixed, and Envoy can’t switch to stream if the payload is larger. Thus, we needed to define a limit of the payload: If a request’s payload size is greater than that, Envoy will return a 413 status code and fail the request. The current chosen limit seemed to be effective, not failing any requests nor causing increases in memory consumption.
The way forward
Once we activated the buffer filter option, we saw the 400 errors disappear from our metrics.
This was a long and complex investigation, but totally worth it. Every potential issue, even if it only affects a small subset of requests, must be fully investigated and understood to provide a truly reliable service.
The troubleshooting effort also helped us uncover a potential issue with clients sending incomplete requests. There is still an ongoing investigation into that aspect, as well as why flask doesn’t reject requests with a non-zero Content-Length header but without an actual payload—they should never reach the application code!
The team and the company understand the importance of reliability. Ownership is one of our core values, and that encourages these kinds of deep investigations. I had a lot of support and interesting discussions during the debugging, which helped me to learn a lot of details about how our infrastructure works in depth. I hope this write-up also helped you learn something new!
In-App Subscriptions Made Easy
See why thousands of the world's tops apps use RevenueCat to power in-app purchases, analyze subscription data, and grow revenue on iOS, Android, and the web.