A/B Price Testing Guide for Mobile Apps
Key questions and expert answers for mobile apps looking to run price testing.


Jakub Chour
What’s the best way to run A/B price testing for mobile apps? What data and tools should you use? How do you measure success? I’m Jakub, Head of Growth at Queer dating app HER, and I’ll be your guide today, answering these questions and more.
Should you A/B test offerings and pricing?
There are a few levers you can pull to grow revenue for your mobile subscription app:
- Adding new users
- Decreasing churn
- Converting users to paid plans
- Cross-selling and upselling existing users
Outside of “adding new users”, the rest of these levers rely on maximizing the value of your existing users. A/B testing both pricing and promotions is a key tool here. When presenting users with an offer they can’t refuse, you need to show a paywall.
Just making a change to pricing across all of your customers and then monitoring the results that follow won’t allow you to reliably infer the impacts of that change because your test results might be skewed by multiple external factors, like seasonality. That’s why you’ll need to implement a controlled and measured A/B test.
A/B testing is the most effective method of price testing for mobile apps to maximize the value of your existing users. In this method, users are bucketed into two (or more) segments, each of which is offered a different price to determine which offers yield the most positive results.
The right data and tools for A/B price testing for mobile apps
Just this year, we did 12 revenue-related A/B tests, and I can tell you that it’s complicated without proper data infrastructure.
The analysis you can conduct based on app store data alone ranges from fairly limited to nearly useless, and it is only suitable for very small businesses with low engineering bandwidth. For example, if you might want to understand the impacts of your test on a specific group of users, perhaps by geography or operating system, you need access to reliable user-level data to gain the proper insights.
While it’s easy to test a paywall conversion rate alone with basically any tool, it’s hard to get your data straight when it comes to comparing down-funnel impacts like churning comparisons or refunds. Even if you use tools like Firebase to A/B test users, you can only optimize toward one goal, and this won’t take returns and different product events into consideration.
Implementing a price experiment
Forming a price testing hypothesis
Having a strong, hypothesis-driven testing plan is a critical step for drawing meaningful conclusions. Price testing isn’t just limited to selecting the best dollar amount; you can also test the impact of changing:
- Product durations
- Trial and offer types
- Pricing localization
- How features are packaged and bundled into plans
If you need inspiration for which exact price points, durations, and offers to test, look no further than your competition and customers. Assess what direct and even indirect competitors offer for pricing and promotions. You can also tap into formal or informal customer research to get ideas for what you should prioritize testing.
Determining success metrics
Once you know what you want to test, you’ll want to ensure that you have a plan in place to measure the success of your experiment. It’s important to consider more than just initial conversions.
At the end of the day, lifetime value (LTV) is the key metric you’re looking to grow through your price experiments. That means you’ll want to understand how your test impacts the following areas:
- Initial conversion: This is the place where you measure the most immediate impact of your experimentation, the point where a customer starts a trial or accepts some other offer.
- Paying customers: The point where a customer becomes a revenue-generating subscriber who contributes to your lifetime value.
- Revenue: You can think of the revenue you’ve generated during an experiment as the “realized LTV” of those customer cohorts. The immediate value of a customer’s subscription is an imperfect snapshot of the full impact of price changes over time. The amount of revenue your customers earn you will be impacted by churn, upgrades, and refunds over time.
One popular tool for A/B price testing for mobile apps is Firebase, but if testing with Firebase, you cannot track most of the above out of the box. The test output will only show whether your targeted success event (that you must specify) had a higher or lower conversion rate between different variants — there’s no reporting of revenue impact and/or the subscription journey. This is rarely sufficient: You might want to measure revenues, including refunds or events somewhere near the beginning of the funnel. There is a workaround, including exporting data into BigQuery, but it requires you to invest much more time into evaluation.
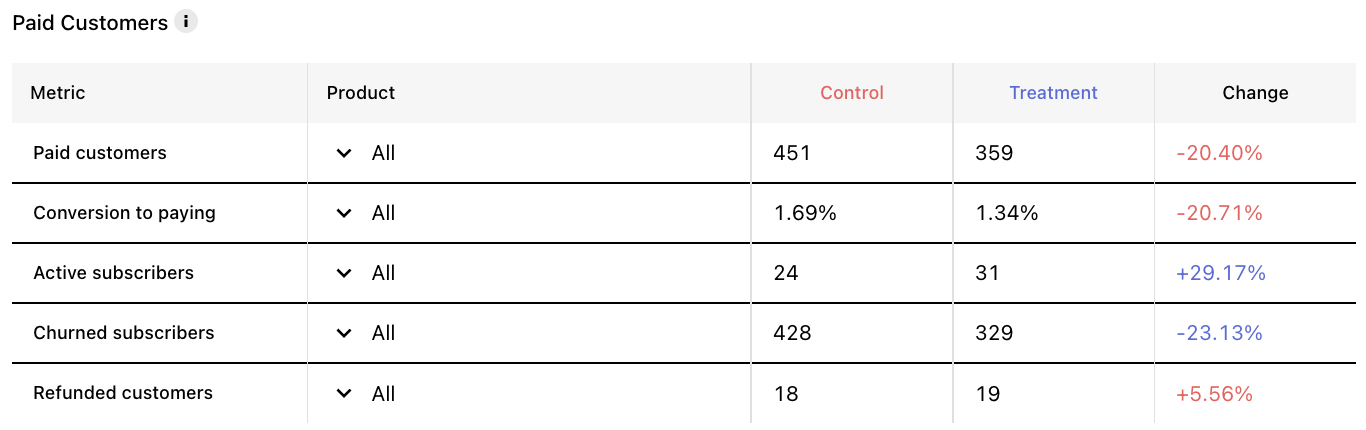
Another A/B testing tool comes from the RevenueCat app monetization platform. RevenueCat Experiments allows mobile apps to track the impact of their pricing experiments throughout the full subscription funnel. Pre-built data visualizations make it easy to understand how your tests impact initial conversions, trial conversion and completion, active subscriptions, churn, refunds, MRR, and more.
Segmentation and sample size
Ensure that you take into consideration what user segments you want to test and whether you have a significant sample size overall. I’d advise testing separately within each country to ensure that your data is not clouded by differing market dynamics, foreign exchange rates, and purchasing power levels. You’ll also need to ensure that the segment you’re testing within is large enough to generate sufficient data; otherwise, you’ll likely have to extend the time horizon of your experiments. If you’re receiving hundreds of purchases a day, it may take 2-3 weeks for the test to deliver the first results, but if it’s just a dozen a day, then it can take much longer. If your experiment runs for too long, it may also be difficult to isolate the impact of your test from other changes, outside your experiment, that have occurred between the start and end of the experiments.
Interpreting your A/B test
So, are you seeing a winner? Great, but hold your horses for a bit. Let’s look at the common pitfalls of pricing testing experiments, so you know you are on the safe side.
Declaring the winner too early
Seeing an immediate increase in conversion and excitedly declaring it the “right answer” is a common mistake that I’m often inclined to make. I invested a lot into that test and I want to see it succeed. Even if the test has not enough data to be statistically significant but shows promising results, the urge to put it into production is strong, but please wait a little bit. The hard truth is that even if you have very good test hypotheses, the majority of A/B tests fail to yield a better outcome in the real world, as they end up not being statistically significant or perform worse than the control with consideration for impact to LTV.
Declaring the winner based on the wrong metrics
Don’t forget about the bigger-picture success criteria you defined earlier. A new, cheaper variation of a trial offering might win on both conversion rate and new user D-30 revenues, but it may disappoint on user LTV, which means you end up getting much less money in the long run. Similarly, you can win on LTV easily with a hard paywall with trial but end up having fewer users start using the app, which can also mean lower growth.
Again, this is where ensuring that you have quality data comes into play. Lighter A/B price testing tools for mobile apps also have some underlying limitations. Some, like Firebase, create participant IDs based on the device level, not the account level. Although it’s not a problem most of the time, a user who has two devices will be counted as two.
Firebase, Google Analytics, and some other tools also don’t send any trial conversions and renewals while the app is inactive. This means that it will be very precise if you are measuring consumables revenue, but it will be somewhat off (over-measuring) for subscription revenues over a longer period.
RevenueCat solves for this with the in-app purchase SDK and backend that power its Experiments product, providing access to real-time cross-platform event data that’s tied to a unique user ID (regardless of device) even if the app is inactive.
Next steps once your price test is done
Congrats on your successful A/B test! The last consideration is thinking about retesting from time to time. Even when your test is statistically significant, it doesn’t mean it will be a winner until the end of time. Your users will change; your traffic, product, and competition will change. It’s smart to repeat or iterate your best A/B tests to capture these changes
Segment your results
If you have access to your test data and your sample size is large enough, see how the test may have performed differently among different user segments. For us, it’s typical for older users to pay more, but a lot of our users are aged 18-24. This means that we will always have a group of folks that reacts less positively to any price changes and therefore skews the results toward no statistically significant change.
Monitor your experiments closely
It’s not uncommon for things to go south: You may find out that the test you did a few weeks ago actually wasn’t as successful as you initially thought. When you are looking at dipping charts, it’s good to correlate your charts with the major tests/releases you did.
In-App Subscriptions Made Easy
See why thousands of the world's tops apps use RevenueCat to power in-app purchases, analyze subscription data, and grow revenue on iOS, Android, and the web.